
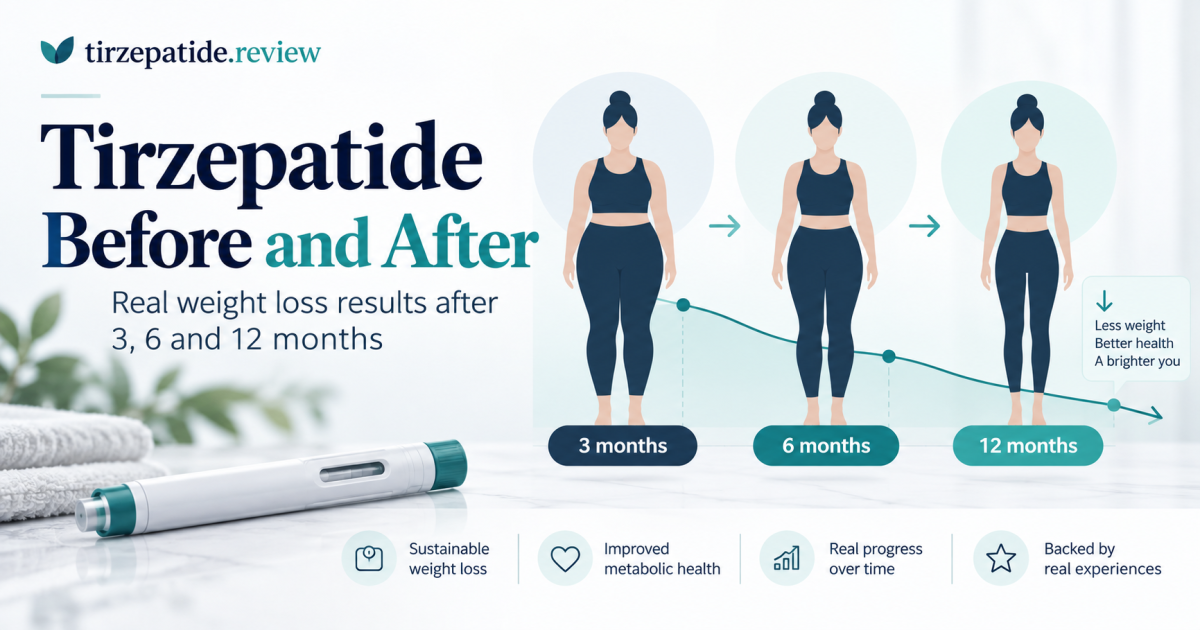
Tirzepatide Before and After: Real Weight Loss Results After 3, 6 and 12 Months
Realistic tirzepatide before and after results at 3, 6 and 12 months, based on trial averages, plus why online photos can mislead and what affects results.
Tirzepatide Before and After: Real Weight Loss Results After 3, 6 and 12 Months
If you want the short version, tirzepatide weight loss usually looks much less dramatic at 3 months than the before-and-after photos filling social media — and much more dramatic by 12 months. In one large real-world study, people who remained on tirzepatide had lost an average of about 5.9% of their starting weight at 3 months, 10.1% at 6 months, and 15.3% at 12 months.
That means someone starting at 250 pounds would be roughly 15 pounds down at 3 months, 25 pounds down at 6 months, and 38 pounds down at 12 months if they followed those averages. But averages are not promises. Some people lose considerably more, some considerably less, and the first few months can look frustratingly ordinary before the difference becomes obvious.
The Before-and-After Photo Hides the Most Interesting Part
A before photo and an after photo can make a year of treatment look like one giant jump.
It usually isn't.
There is the first month when someone is still on a starter dose. There are weeks when the scale barely changes. There are dose increases that suddenly make appetite feel completely different. There are holidays, constipation, water-weight swings, vacations, stressful weeks, and mornings when the number on the scale somehow goes up despite doing everything "right."
The transformation photo removes all of that and leaves two images. The timeline is where the useful story actually is.
Tirzepatide Results at 3 Months: Usually Noticeable, Rarely Finished
Three months is often the point where people decide whether tirzepatide is "working." It is also early enough to make that judgment misleading.
A large U.S. real-world analysis found an average on-treatment weight reduction of about 5.9% at 3 months. Other shorter real-world studies have reported roughly 7% to 8% average loss over about 12 weeks in selected groups of adults with obesity who did not have diabetes.
Those numbers make 3-month results meaningful, but not necessarily spectacular. At 200 pounds, 5.9% is about 12 pounds. At 300 pounds, it is about 18 pounds.
On a scale, that is real progress. In a mirror, it may still be subtle. In clothing, it may show up before anyone else notices.
What 3 Months Can Look Like
- 1Starting weight 180 lb — 5.9% is about 11 lb lost
- 2Starting weight 200 lb — 5.9% is about 12 lb lost
- 3Starting weight 250 lb — 5.9% is about 15 lb lost
- 4Starting weight 300 lb — 5.9% is about 18 lb lost
These are illustrations based on the study average, not predictions of what any one person should lose.
The Weird Part: You May Feel the Drug Before You Look Different
One of the strange things about the first few months is that the internal change can be much bigger than the visual one.
A person may already be eating half the restaurant meal they used to finish, rarely thinking about snacks, and feeling full from portions that once looked tiny — while still wondering why their before-and-after photos look almost identical.
That gap can be psychologically annoying. Tirzepatide may change appetite quickly. Bodies tend to change shape more slowly.
Tirzepatide Results at 6 Months: This Is Where the Difference Often Becomes Harder to Miss
By six months, the story often looks very different.
In the large real-world study, average on-treatment weight loss reached about 10.1% at 6 months. A huge UK digital-health cohort published later found an average loss of 13.5% at six months among participants with recorded follow-up weights.
Those studies should not be treated as if they are interchangeable — they involved different populations and real-world treatment patterns. But they point in the same direction: a lot can happen between month three and month six.
What 10% Weight Loss Actually Looks Like
- 1180 lb becomes roughly 162 lb
- 2200 lb becomes roughly 180 lb
- 3250 lb becomes roughly 225 lb
- 4300 lb becomes roughly 270 lb
Ten percent is often enough for people to notice more than a number. Belt holes change. Clothes sit differently. The face may look leaner. Walking can feel easier. Someone who sees you every day may notice nothing, while a friend who has not seen you for two months immediately asks what happened.
Six Months Is Also Where Comparison Can Get Toxic
This is roughly when social media can start messing with your expectations.
You may be 25 pounds down and feeling disappointed because somebody on TikTok says they lost 55. Another person may be thrilled with 15 pounds because it is the first time their weight has moved meaningfully in years.
Neither person's result tells you what your body should have done by month six.
Tirzepatide Results at 12 Months: The Before-and-After Stage
A year is where many of the transformations people associate with tirzepatide become much more plausible.
The large U.S. real-world study found average on-treatment weight loss of about 15.3% at 12 months. In the newer UK cohort of hundreds of thousands of tirzepatide users, average recorded weight loss reached 17.4% at 12 months.
At that point, the arithmetic starts to look dramatic. Fifteen percent of 200 pounds is 30 pounds. Fifteen percent of 250 is nearly 38 pounds. Fifteen percent of 300 is 45 pounds.
What 15.3% Weight Loss Looks Like
- 1180 lb — about 28 lb lost
- 2200 lb — about 31 lb lost
- 3250 lb — about 38 lb lost
- 4300 lb — about 46 lb lost
Again, these are examples built from an average. They are useful for making percentages feel real, not for setting a personal deadline.
And 12 Months Still Isn't Necessarily the End
This is easy to miss when every article wants a neat one-year result.
In the major SURMOUNT-1 trial, adults with obesity or overweight without diabetes continued treatment for 72 weeks — roughly 16 and a half months. Average weight loss by week 72 was 15.0% with 5 mg, 19.5% with 10 mg, and 20.9% with 15 mg.
At the higher doses, roughly half or more of participants reached at least 20% weight loss. That is one reason judging the entire treatment by what happened in the first three months can be so misleading.
Why Doesn't Everyone Get the Same Before-and-After?
Because "taking tirzepatide for six months" does not mean six identical months for everybody.
- 1People start at different weights
- 2Doses are increased at different speeds
- 3Some stay on lower doses
- 4Some have type 2 diabetes and some do not
- 5Side effects can limit dose escalation
- 6Other medications can affect weight
- 7Some people miss doses or have treatment interruptions
- 8Appetite response varies enormously
- 9Diet, activity, sleep, and health conditions differ
- 10Some people are simply stronger biological responders than others
That last point matters more than people like to admit. Two people can follow similar plans and get very different numbers.
Having Type 2 Diabetes Can Change the Numbers
Weight-loss results in studies of people with type 2 diabetes are often somewhat lower than results in trials made up of people without diabetes.
That does not mean tirzepatide is failing. It means comparing your progress with a trial, influencer, or before-and-after photo only makes sense if the comparison is remotely similar to your own situation.
The Scale Is Not the Only Before-and-After
Weight is easy to photograph and easy to graph, so it gets almost all the attention.
But people may notice changes in waist circumference, clothing size, mobility, appetite, glucose control, and the amount of mental space food occupies before the final "after" picture exists.
There is also body composition. In a 12-week real-world study, most of the measured weight reduction came from fat mass, although some lean mass was lost as well. That is a reminder that losing 30 pounds is not one simple biological event.
Why Your Photos May Change Suddenly Even When Your Weight Doesn't
Bodies do not reveal every pound equally.
The first 10 pounds may barely register in a photo. Another 10 can suddenly change the jawline, waist, or way clothing hangs. Where someone loses fat is individual, which is why visual progress does not always move in lockstep with the scale.
That is also why taking photos under similar lighting, clothing, distance, and posture gives a much more honest comparison than trying to judge yourself in the mirror every morning.
What If You're Losing Much Slower Than These Numbers?
An average is not a minimum requirement.
If a study reports 10% average weight loss at six months, there were people above that number and people below it. Some participants may also have reached higher doses sooner, stayed on treatment more consistently, or started with different medical circumstances.
Slow progress can still be progress. What matters more is the pattern over time and whether the treatment plan makes sense for you — not whether your month-six picture resembles somebody else's.
What If You're Losing Much Faster?
Faster is not automatically better.
A spectacular number can look wonderful on a progress chart while hiding problems such as difficulty eating enough, dehydration, persistent nausea, or loss of lean tissue. If weight is falling very rapidly or eating has become difficult, that is worth discussing with the clinician managing the medication.
The Before-and-After Nobody Posts: Plateaus
A real tirzepatide weight-loss graph is usually not a perfect ski slope.
It falls, flattens, falls again, bounces up, stalls, and eventually slows. Long-term trial data show continued average loss over many months, but that does not mean every individual week produces a lower number.
A three-week plateau in the middle of a year-long treatment story can feel enormous while you are living through it and almost invisible when you look back at the full year.
So What Is a Realistic Tirzepatide Timeline?
If you want a rough picture rather than a promise, real-world data give us a useful framework:
- 1Around 3 months — meaningful progress may be underway, with one large real-world study averaging about 5.9% weight loss
- 2Around 6 months — changes are often much more visible, with roughly 10.1% average loss in that study
- 3Around 12 months — substantial before-and-after differences become more common, with about 15.3% average on-treatment loss
- 4Beyond 12 months — additional weight loss can occur, and major clinical trials have shown average losses approaching or exceeding 20% at higher maintenance doses over longer treatment
Think of those numbers as landmarks, not deadlines.
The Bottom Line
Real tirzepatide before-and-after results are impressive precisely because they build over time. Three months can look modest. Six months can look unmistakable. Twelve months can look like a different person — but not for everyone, and not on the same schedule.
The internet tends to show you the two most photogenic moments and delete everything between them. The evidence tells a better story: weight loss usually accumulates month after month, individual responses spread widely around the average, and the first few months are far too early to predict every person's final result.
So if your month-three photo is not dramatic, that may be perfectly ordinary. The interesting question is not "Do I look like somebody else's after photo yet?" It is "What direction am I moving in over time?"
Frequently Asked Questions
In one large real-world study, people who remained on tirzepatide had lost an average of about 5.9% of their starting body weight at three months. Other short-term studies in selected groups have reported averages around 7% to 8%. Individual results can be substantially higher or lower.
A large U.S. real-world analysis found average on-treatment weight loss of about 10.1% at six months. A newer large UK cohort reported an average of 13.5% among participants with recorded six-month weights. Differences between studies reflect different populations and treatment patterns.
Real-world studies have reported average losses in the range of roughly 15% to 17% after 12 months among people with follow-up data. Individual results vary considerably depending on dose, treatment persistence, medical history, diabetes status, and individual response.
Not necessarily. In a large real-world study, average weight loss at three months was about 5.9%. Tirzepatide treatment also involves gradual dose escalation, so three months may still be relatively early in the overall treatment timeline.
Many show people after a year or more of treatment, and dramatic transformations are more likely to be posted and shared online. Starting weight, dose, treatment duration, clothing, lighting, posture, and individual response can also make before-and-after images look very different.
Yes. Twelve months is not necessarily the end of weight loss. In SURMOUNT-1, treatment continued for 72 weeks, and average weight reductions reached 15.0%, 19.5%, and 20.9% with the 5 mg, 10 mg, and 15 mg doses respectively.
No. Fifteen percent is an average seen around certain time points and populations, not a guaranteed outcome. Some people lose considerably more and others considerably less.
Sources
The weight-loss timelines and averages discussed on this page are based on clinical-trial and real-world research rather than selected social-media transformations:
- 1Rodriguez PJ, et al. Semaglutide vs Tirzepatide for Weight Loss in Adults With Overweight or Obesity. JAMA Internal Medicine.
- 2Jastreboff AM, et al. Tirzepatide Once Weekly for the Treatment of Obesity. New England Journal of Medicine.
- 3Real-World Effectiveness and Treatment Patterns of Tirzepatide in a Large UK Digital Health Cohort. PubMed.
- 4A real-world study of tirzepatide for weight loss in adults without diabetes mellitus. PubMed.
- 5Early changes in body composition with tirzepatide in adults with obesity: a real-world BIA study. PubMed.
Study averages describe groups, not individual outcomes. Treatment dose, duration, medical history, diabetes status, side effects, adherence, lifestyle, and individual biology can all affect weight loss. Written for general education; this page is not medical advice. Tirzepatide.review is independent and is not affiliated with, sponsored by, or endorsed by Eli Lilly and Company.

Nataliia Bondarchuk
Author
Comments (0)
Be the first to comment on this article.
More articles